00 - Setup#
import os
import stampede as st
slides = {
    1: {
        "exprmat": "exprMat_file.csv.gz",
        "metadata": "metadata_file.csv.gz",
        "fov_positions": "fov_positions_file.csv.gz",
    }
}
# optional filepath prefix
data_dir = "data"
os.makedirs(st.config["adata_dir"], exist_ok=True)
01 - Read#
import pandas as pd
import scanpy as sc
samples_df = pd.read_table("data/sample2fov.csv", sep=",")
samples_df.sort_values(["slide", "fov_start"], inplace=True)

st.validate_input(slides, samples_df, data_dir)

samples_df
| Donor | Treatment | Timepoint | sample | slide | fov_start | fov_end | |
|---|---|---|---|---|---|---|---|
| 0 | 6 | Medium | 1h | Medium_1h_don6 | 1 | 1 | 9 |
| 1 | 5 | Medium | 1h | Medium_1h_don5 | 1 | 10 | 18 |
| 2 | 4 | Medium | 1h | Medium_1h_don4 | 1 | 19 | 27 |
| 3 | 3 | Medium | 1h | Medium_1h_don3 | 1 | 28 | 36 |
| 4 | 2 | Medium | 1h | Medium_1h_don2 | 1 | 37 | 45 |
| ... | ... | ... | ... | ... | ... | ... | ... |
| 91 | 5 | NaCl+Taurine | 24h | NaCl+Taurine_24h_don5 | 2 | 388 | 396 |
| 92 | 4 | NaCl+Taurine | 24h | NaCl+Taurine_24h_don4 | 2 | 397 | 405 |
| 93 | 3 | NaCl+Taurine | 24h | NaCl+Taurine_24h_don3 | 2 | 406 | 414 |
| 94 | 2 | NaCl+Taurine | 24h | NaCl+Taurine_24h_don2 | 2 | 415 | 423 |
| 95 | 1 | NaCl+Taurine | 24h | NaCl+Taurine_24h_don1 | 2 | 424 | 432 |
96 rows × 7 columns
adata_file = os.path.join(st.config["adata_dir"], "raw_data.h5ad")
st.read_cosmx(
    slides,
    samples_df,
    adata_file,
    # samples_df_columns=["Donor", "Treatment", "Timepoint"],
    # metadata_df_columns=[
    #     'nCount_RNA', 'nFeature_RNA', "nCount_negprobes", "nCount_falsecode", "Area.um2", "qcFlagsFOV"
    # ],
    # nrows=100,
    data_dir=data_dir,
    overwrite=False,
    verbose=True,
)
adata_file already exists and overwrite=False
'adatas/raw_data.h5ad'
adata = sc.read_h5ad(adata_file)
adata.obs
| fov | cell_ID | slide | slide-fov | Area | AspectRatio | CenterX_local_px | CenterY_local_px | Width | Height | ... | errorCtPerCellEstimate | percOfDataFromErrorPerCell | qcFlagsFOV | cell | sample | Donor | Treatment | Timepoint | fov_start | fov_end | |
|---|---|---|---|---|---|---|---|---|---|---|---|---|---|---|---|---|---|---|---|---|---|
| slide-fov-cell_ID | |||||||||||||||||||||
| 1-1-17 | 1 | 17 | 1 | 1-1 | 3240 | 0.89 | 3792 | 840 | 65 | 73 | ... | 97.281767 | 0.142455 | Pass | c_2_1_17 | Medium_1h_don6 | 6 | Medium | 1h | 1 | 9 |
| 1-1-50 | 1 | 50 | 1 | 1-1 | 5656 | 0.85 | 3348 | 1026 | 105 | 89 | ... | 97.281767 | 0.142455 | Pass | c_2_1_50 | Medium_1h_don6 | 6 | Medium | 1h | 1 | 9 |
| 1-1-546 | 1 | 546 | 1 | 1-1 | 5500 | 0.98 | 3715 | 3090 | 87 | 85 | ... | 97.281767 | 0.142455 | Pass | c_2_1_546 | Medium_1h_don6 | 6 | Medium | 1h | 1 | 9 |
| 1-1-698 | 1 | 698 | 1 | 1-1 | 3604 | 0.87 | 3932 | 3467 | 77 | 67 | ... | 97.281767 | 0.142455 | Pass | c_2_1_698 | Medium_1h_don6 | 6 | Medium | 1h | 1 | 9 |
| 1-1-774 | 1 | 774 | 1 | 1-1 | 2604 | 0.82 | 893 | 3653 | 55 | 67 | ... | 97.281767 | 0.142455 | Pass | c_2_1_774 | Medium_1h_don6 | 6 | Medium | 1h | 1 | 9 |
| ... | ... | ... | ... | ... | ... | ... | ... | ... | ... | ... | ... | ... | ... | ... | ... | ... | ... | ... | ... | ... | ... |
| 1-428-735 | 428 | 735 | 1 | 1-428 | 4188 | 0.92 | 2419 | 3332 | 79 | 73 | ... | 61.534091 | 0.119327 | Pass | c_2_428_735 | Medium_4h_don3 | 3 | Medium | 4h | 424 | 432 |
| 1-428-833 | 428 | 833 | 1 | 1-428 | 2932 | 0.94 | 2522 | 3986 | 65 | 61 | ... | 61.534091 | 0.119327 | Pass | c_2_428_833 | Medium_4h_don3 | 3 | Medium | 4h | 424 | 432 |
| 1-429-8 | 429 | 8 | 1 | 1-429 | 2936 | 0.85 | 869 | 90 | 67 | 57 | ... | 94.791667 | 0.178882 | Pass | c_2_429_8 | Medium_4h_don3 | 3 | Medium | 4h | 424 | 432 |
| 1-431-156 | 431 | 156 | 1 | 1-431 | 2756 | 0.94 | 1656 | 2478 | 61 | 65 | ... | 53.867021 | 0.183343 | Pass | c_2_431_156 | Medium_4h_don3 | 3 | Medium | 4h | 424 | 432 |
| 1-431-158 | 431 | 158 | 1 | 1-431 | 3308 | 0.94 | 714 | 2508 | 65 | 69 | ... | 53.867021 | 0.183343 | Pass | c_2_431_158 | Medium_4h_don3 | 3 | Medium | 4h | 424 | 432 |
2000 rows × 92 columns
02 - QC#
import matplotlib.pyplot as plt
st.pp.gene_qc(adata)
adata.var
| is_negctrl | is_sysctrl | nCell | pctCell | nTranscript | meanTranscript | signal2noise | |
|---|---|---|---|---|---|---|---|
| ABCB7 | False | False | 45 | 2.25 | 49 | 0.0245 | NaN |
| ABCB8 | False | False | 110 | 5.50 | 118 | 0.0590 | NaN |
| ABCC1 | False | False | 67 | 3.35 | 72 | 0.0360 | NaN |
| ABCC4 | False | False | 50 | 2.50 | 54 | 0.0270 | NaN |
| ABCE1 | False | False | 148 | 7.40 | 161 | 0.0805 | NaN |
| ... | ... | ... | ... | ... | ... | ... | ... |
| ZDHHC21 | False | False | 67 | 3.35 | 75 | 0.0375 | NaN |
| ZFP36 | False | False | 572 | 28.60 | 800 | 0.4000 | NaN |
| ZNF706 | False | False | 198 | 9.90 | 232 | 0.1160 | NaN |
| ZNRF1 | False | False | 71 | 3.55 | 76 | 0.0380 | NaN |
| ZWINT | False | False | 66 | 3.30 | 71 | 0.0355 | NaN |
1000 rows × 7 columns
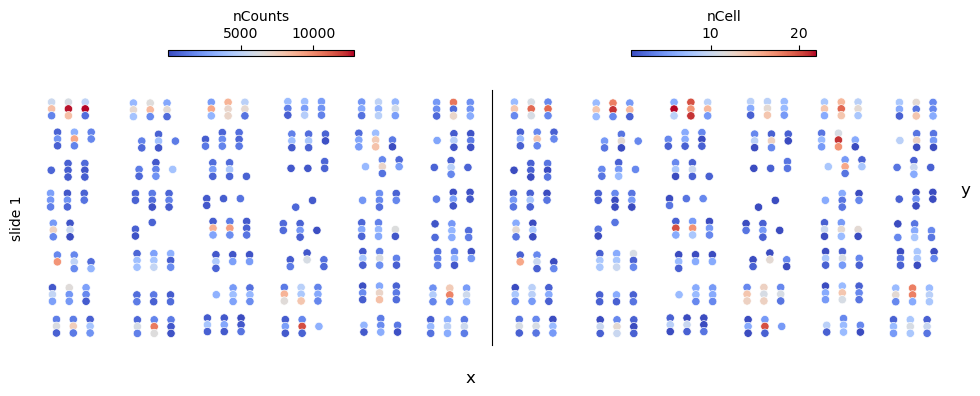
st.pp.slide_qc(adata, slides, data_dir)
adata.uns["fov_metadata"]
| slide-fov | slide | fov | x | y | nCounts | nCell | meanCountsPerCell | nCount_negprobes | mean_NegProbe-CountsPerCell | nCount_falsecode | mean_FalseCode-CountsPerCell | meanCellSize | Failed_AtoMX_QC | |
|---|---|---|---|---|---|---|---|---|---|---|---|---|---|---|
| 0 | 1-1 | 1 | 1 | 256 | 145130 | 5556 | 7 | 793.714286 | 1 | 0.142857 | 32 | 4.571429 | 58.018832 | 0 |
| 1 | 1-2 | 1 | 2 | 4512 | 145130 | 6140 | 11 | 558.181818 | 2 | 0.181818 | 33 | 3.000000 | 45.164922 | 0 |
| 2 | 1-3 | 1 | 3 | 8768 | 145130 | 5061 | 4 | 1265.250000 | 3 | 0.750000 | 23 | 5.750000 | 91.449104 | 0 |
| 3 | 1-4 | 1 | 4 | 256 | 140874 | 8240 | 14 | 588.571429 | 2 | 0.142857 | 37 | 2.642857 | 45.700784 | 0 |
| 4 | 1-5 | 1 | 5 | 4512 | 140874 | 12586 | 19 | 662.421053 | 7 | 0.368421 | 74 | 3.894737 | 49.871777 | 0 |
| ... | ... | ... | ... | ... | ... | ... | ... | ... | ... | ... | ... | ... | ... | ... |
| 346 | 1-425 | 1 | 425 | 63155 | 68921 | 666 | 2 | 333.000000 | 0 | 0.000000 | 1 | 0.500000 | 30.844722 | 0 |
| 347 | 1-427 | 1 | 427 | 58899 | 64665 | 956 | 3 | 318.666667 | 1 | 0.333333 | 3 | 1.000000 | 39.081555 | 0 |
| 348 | 1-428 | 1 | 428 | 63155 | 64665 | 2348 | 5 | 469.600000 | 1 | 0.200000 | 11 | 2.200000 | 48.113137 | 0 |
| 349 | 1-429 | 1 | 429 | 67411 | 64665 | 101 | 1 | 101.000000 | 0 | 0.000000 | 0 | 0.000000 | 42.476597 | 0 |
| 350 | 1-431 | 1 | 431 | 63155 | 60409 | 563 | 2 | 281.500000 | 0 | 0.000000 | 3 | 1.500000 | 43.865477 | 0 |
351 rows × 14 columns
fig, axs = st.pl.slide_qc(adata, columns=["nCounts", "nCell"])
plt.show()
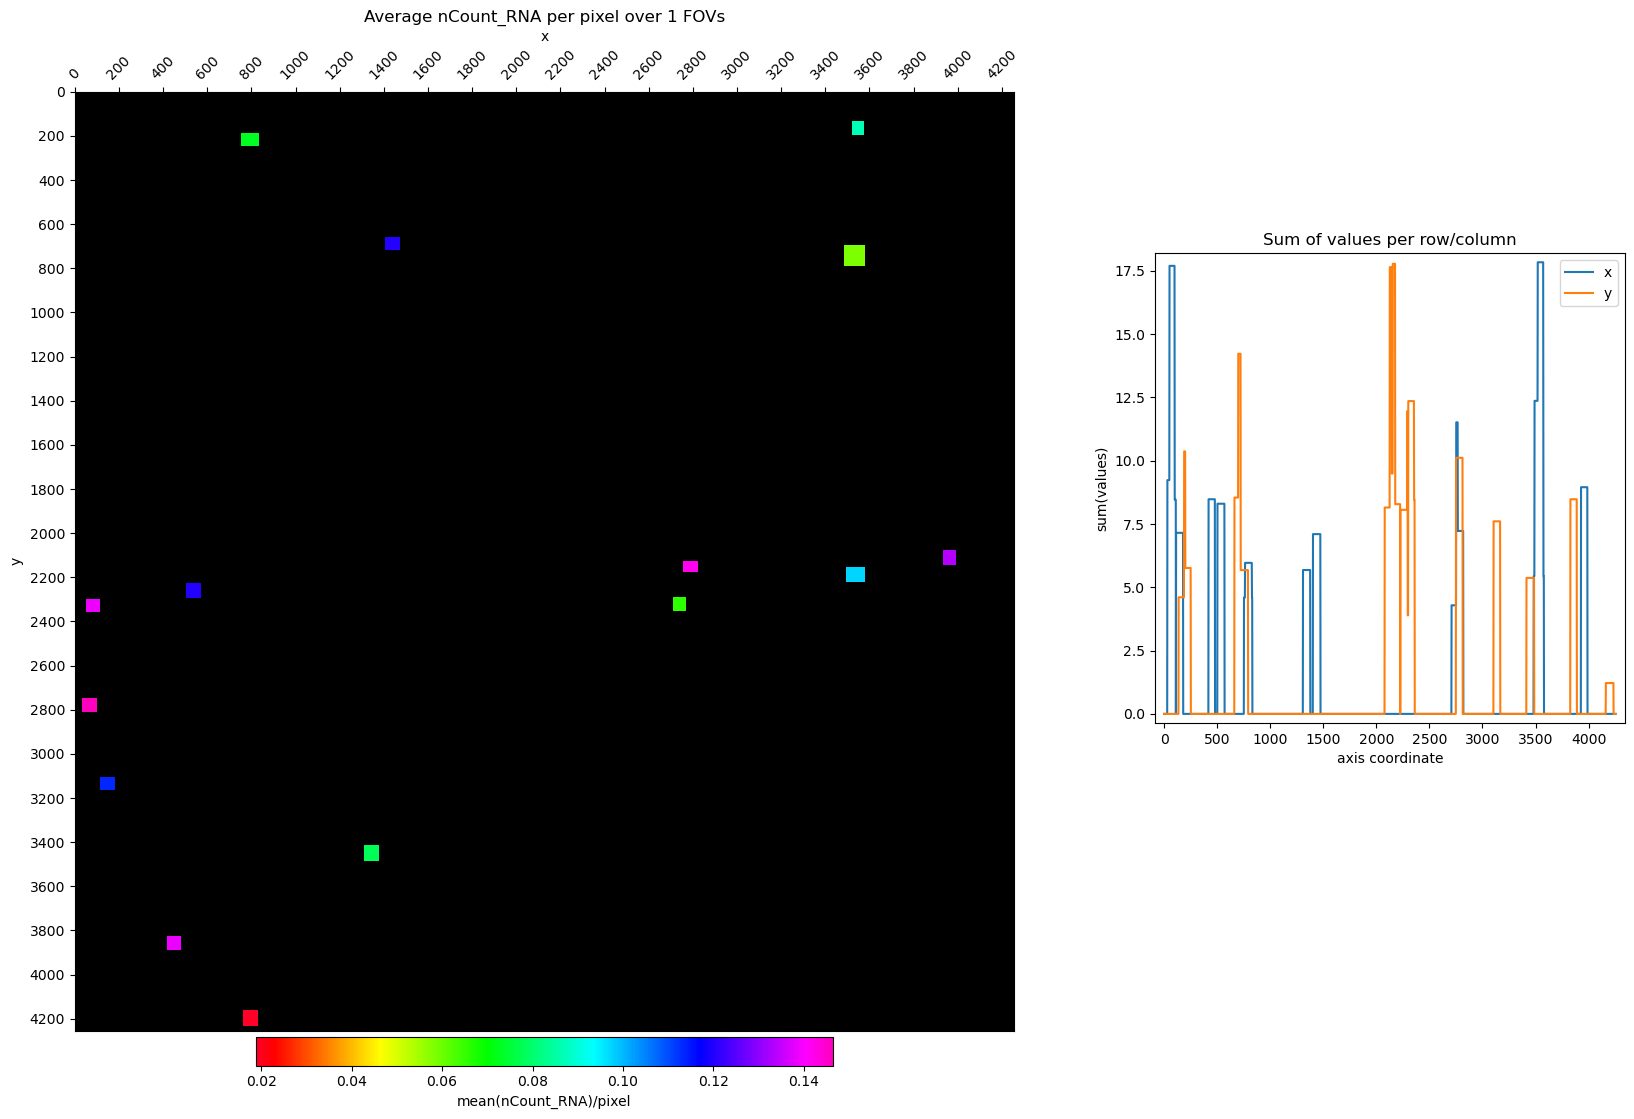
# plot nCount_RNA for a single FOV
idx = adata.obs[(adata.obs["slide-fov"] == "1-15")].index
fig, axs = st.pl.avg_per_pixel(adata[idx, :], column='nCount_RNA', log1p=False, fill_cell_area=True)
plt.show()
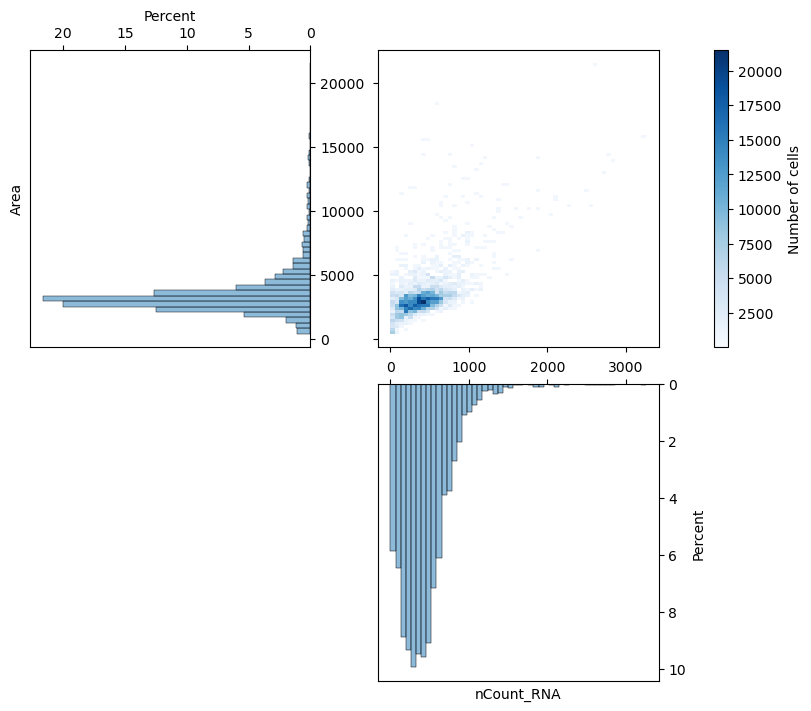
fig, axs = st.pl.correlations(adata, xcolumn="nCount_RNA", ycolumn="Area")
plt.show()
# plot nCount_RNA for the whole slide
fig, axs = st.pl.avg_per_pixel(adata, column='nCount_RNA', log1p=False, fill_cell_area=True)
plt.show()
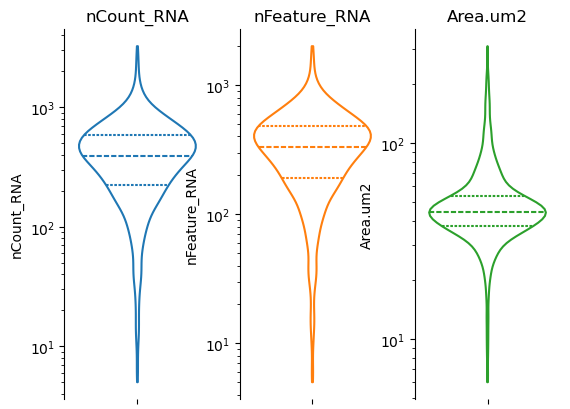
fig, axs = st.pl.violin(adata, ["nCount_RNA", "nFeature_RNA", "Area.um2"])
plt.show()
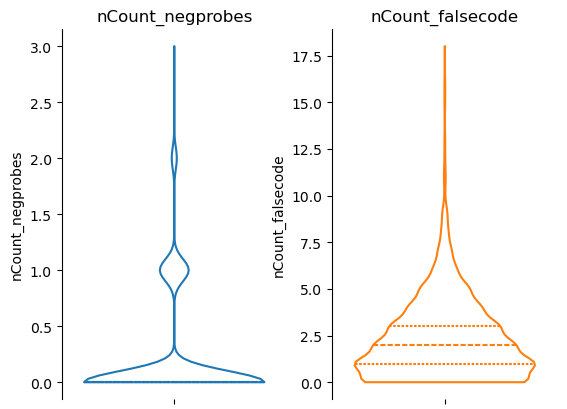
fig, axs = st.pl.violin(adata, ["nCount_negprobes", "nCount_falsecode"], log_scale=(False, False))
plt.show()
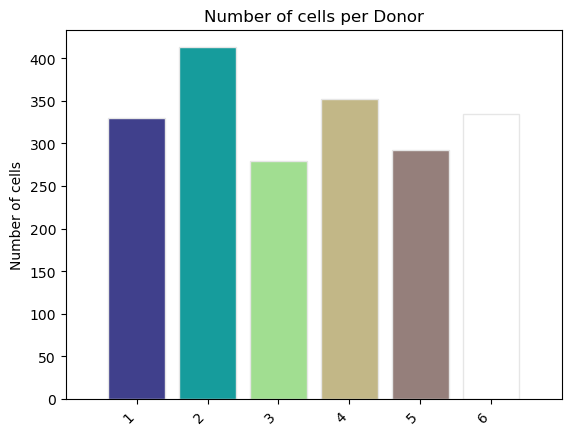
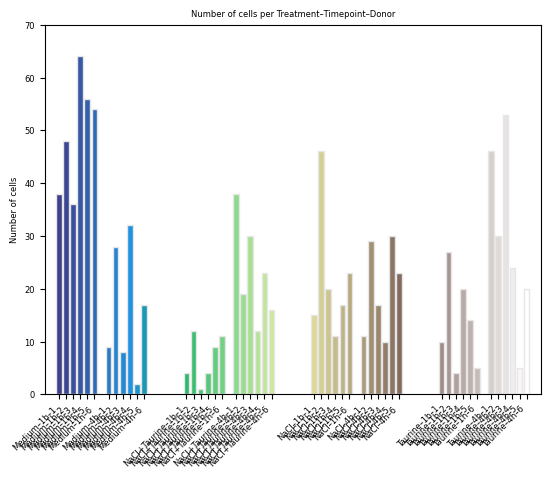
fig, ax = st.pl.ncell_per_condition(adata, "Donor")
plt.show()
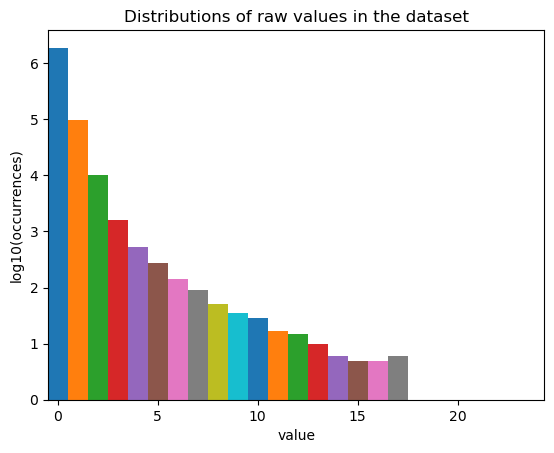
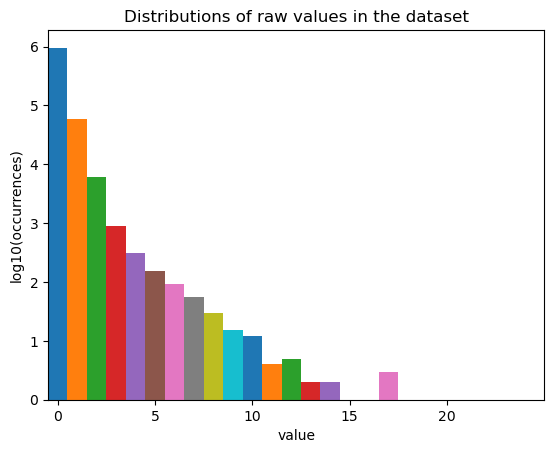
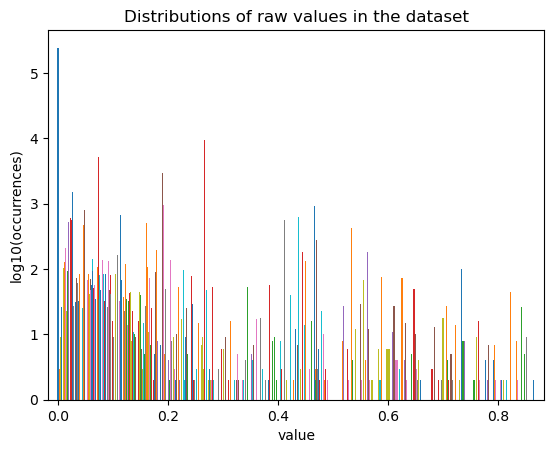
fig, ax = st.pl.value_distribution(adata)
plt.show()
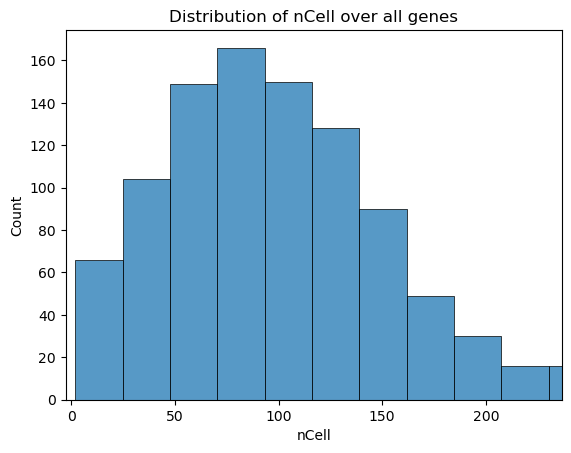
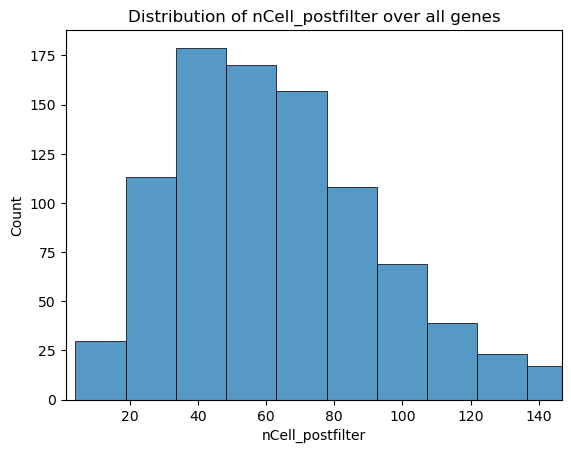
fig, ax = st.pl.column_distribution(adata, "nCell", axis=1)
plt.show()
03 - Filtering#
# TODO: better tutorial dataset
adata.var["signal2noise"] = 2
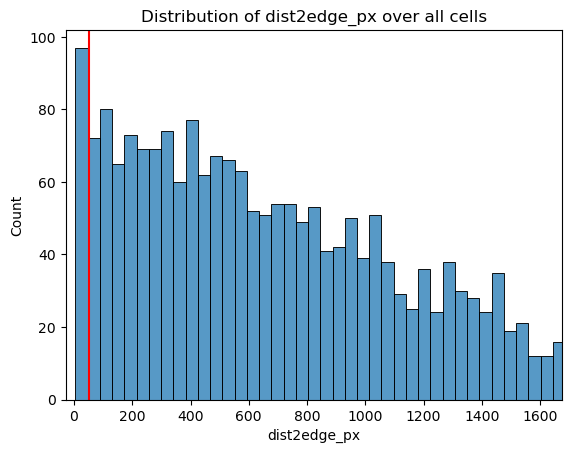
fig, ax = st.pl.column_distribution(adata, "dist2edge_px", plot_kwargs={"bins": 50})

# set a threshold & plot
dist2edge_threshold = adata.obs["dist2edge_px"].quantile(0.05)
print(f"{dist2edge_threshold=}")
ax.axvline(dist2edge_threshold, color="red")

plt.show()
dist2edge_threshold=np.float64(50.0)
adata = st.pp.filter_genes(adata, ncell_min=10)
adata = st.pp.filter_cells(adata, dist2edge_px_min=dist2edge_threshold)
55 genes filtered out, 945 genes remaining.
919 cells filtered out, 1_081 cells remaining.
st.pp.gene_qc_postfilter(adata)
adata.var[["nCell", "nCell_postfilter", "pctCell", "pctCell_postfilter"]]
| nCell | nCell_postfilter | pctCell | pctCell_postfilter | |
|---|---|---|---|---|
| ABCB7 | 45 | 27 | 2.25 | 2.50 |
| ABCB8 | 110 | 67 | 5.50 | 6.20 |
| ABCC1 | 67 | 40 | 3.35 | 3.70 |
| ABCC4 | 50 | 28 | 2.50 | 2.59 |
| ABCE1 | 148 | 91 | 7.40 | 8.42 |
| ... | ... | ... | ... | ... |
| ZDHHC21 | 67 | 40 | 3.35 | 3.70 |
| ZFP36 | 572 | 357 | 28.60 | 33.02 |
| ZNF706 | 198 | 118 | 9.90 | 10.92 |
| ZNRF1 | 71 | 38 | 3.55 | 3.52 |
| ZWINT | 66 | 34 | 3.30 | 3.15 |
945 rows × 4 columns
st.pp.cell_qc_postfilter(adata)
adata.obs[["nFeature_RNA", "nFeature_RNA_postfilter", "nCount_RNA", "nCount_RNA_postfilter"]]
| nFeature_RNA | nFeature_RNA_postfilter | nCount_RNA | nCount_RNA_postfilter | |
|---|---|---|---|---|
| slide-fov-cell_ID | ||||
| 1-1-546 | 1001 | 142 | 1373 | 183 |
| 1-1-774 | 231 | 40 | 267 | 42 |
| 1-1-930 | 740 | 112 | 1029 | 147 |
| 1-2-228 | 419 | 68 | 503 | 74 |
| 1-2-352 | 574 | 89 | 780 | 117 |
| ... | ... | ... | ... | ... |
| 1-428-227 | 252 | 39 | 284 | 41 |
| 1-428-703 | 333 | 60 | 395 | 65 |
| 1-428-735 | 348 | 50 | 419 | 55 |
| 1-428-833 | 381 | 61 | 438 | 72 |
| 1-431-156 | 312 | 51 | 367 | 58 |
1081 rows × 4 columns
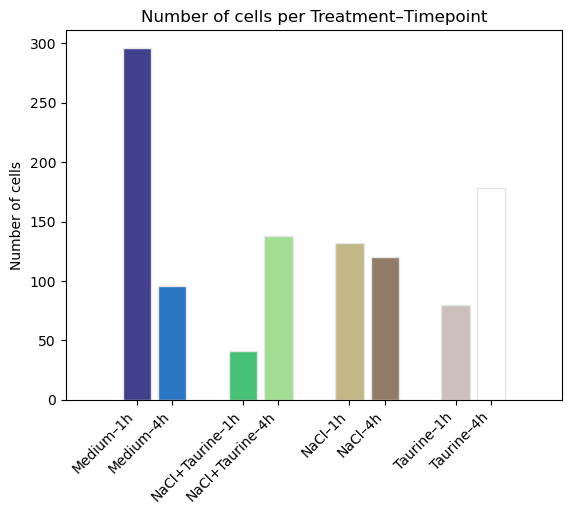
fig, ax = st.pl.ncell_per_condition(
    adata,
    columns = ["Treatment", "Timepoint"],
    offset_between_conditions = 1,
)
plt.show()

fig, ax = st.pl.ncell_per_condition(
    adata,
    columns = ["Treatment", "Timepoint", "Donor"],
    offset_between_conditions = [5, 1],
    text_kwargs={"size": 6},
)
plt.show()
fig, ax = st.pl.value_distribution(adata)
plt.show()
fig, ax = st.pl.column_distribution(adata, "nCell_postfilter", axis=1)
plt.show()
04 - Binarize#
st.pp.binarize(adata)
adata_file = os.path.join(st.config["adata_dir"], "filtered.h5ad")
adata.write_h5ad(adata_file)
binary layer set as adata.X
adata.layers
Layers with keys: counts, binary
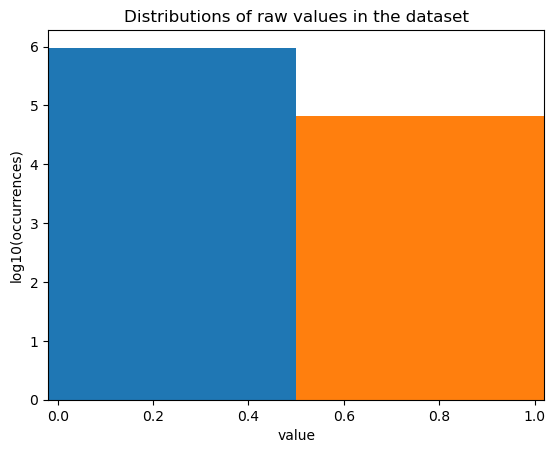
fig, ax = st.pl.value_distribution(adata, min_quantile=0.00, max_quantile=1.00)
plt.show()
05 - Dimensionality reduction#
st.pp.dim_red(adata)
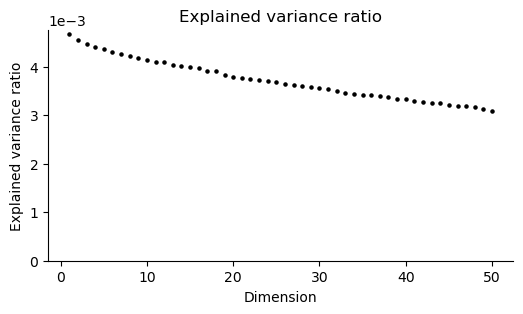
fig, ax = st.pl.scree(adata)
plt.show()
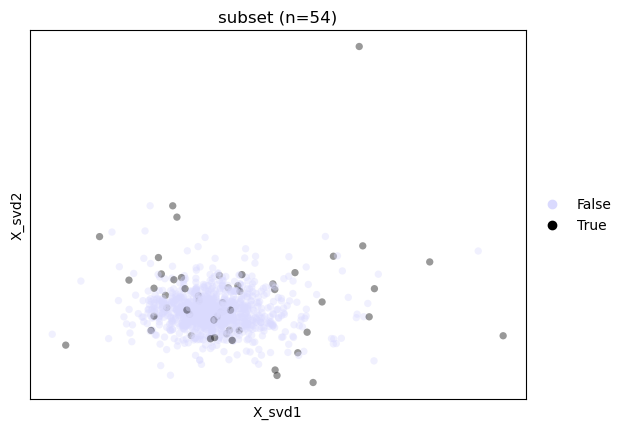
# visualize the effect of subsetting the data
st.tl.sketch(adata, frac=0.05, return_subset=False)
fig, ax = st.pl.sketch(adata, plot_kwargs={"alpha":0.4})
obs_column="subset"
ax.set_title(f"{obs_column} (n={sum(adata.obs[obs_column]):_})")
plt.show()
# optional: subset the data if so desired
# adata = st.tl.sketch(adata, frac=0.05, return_subset=True)
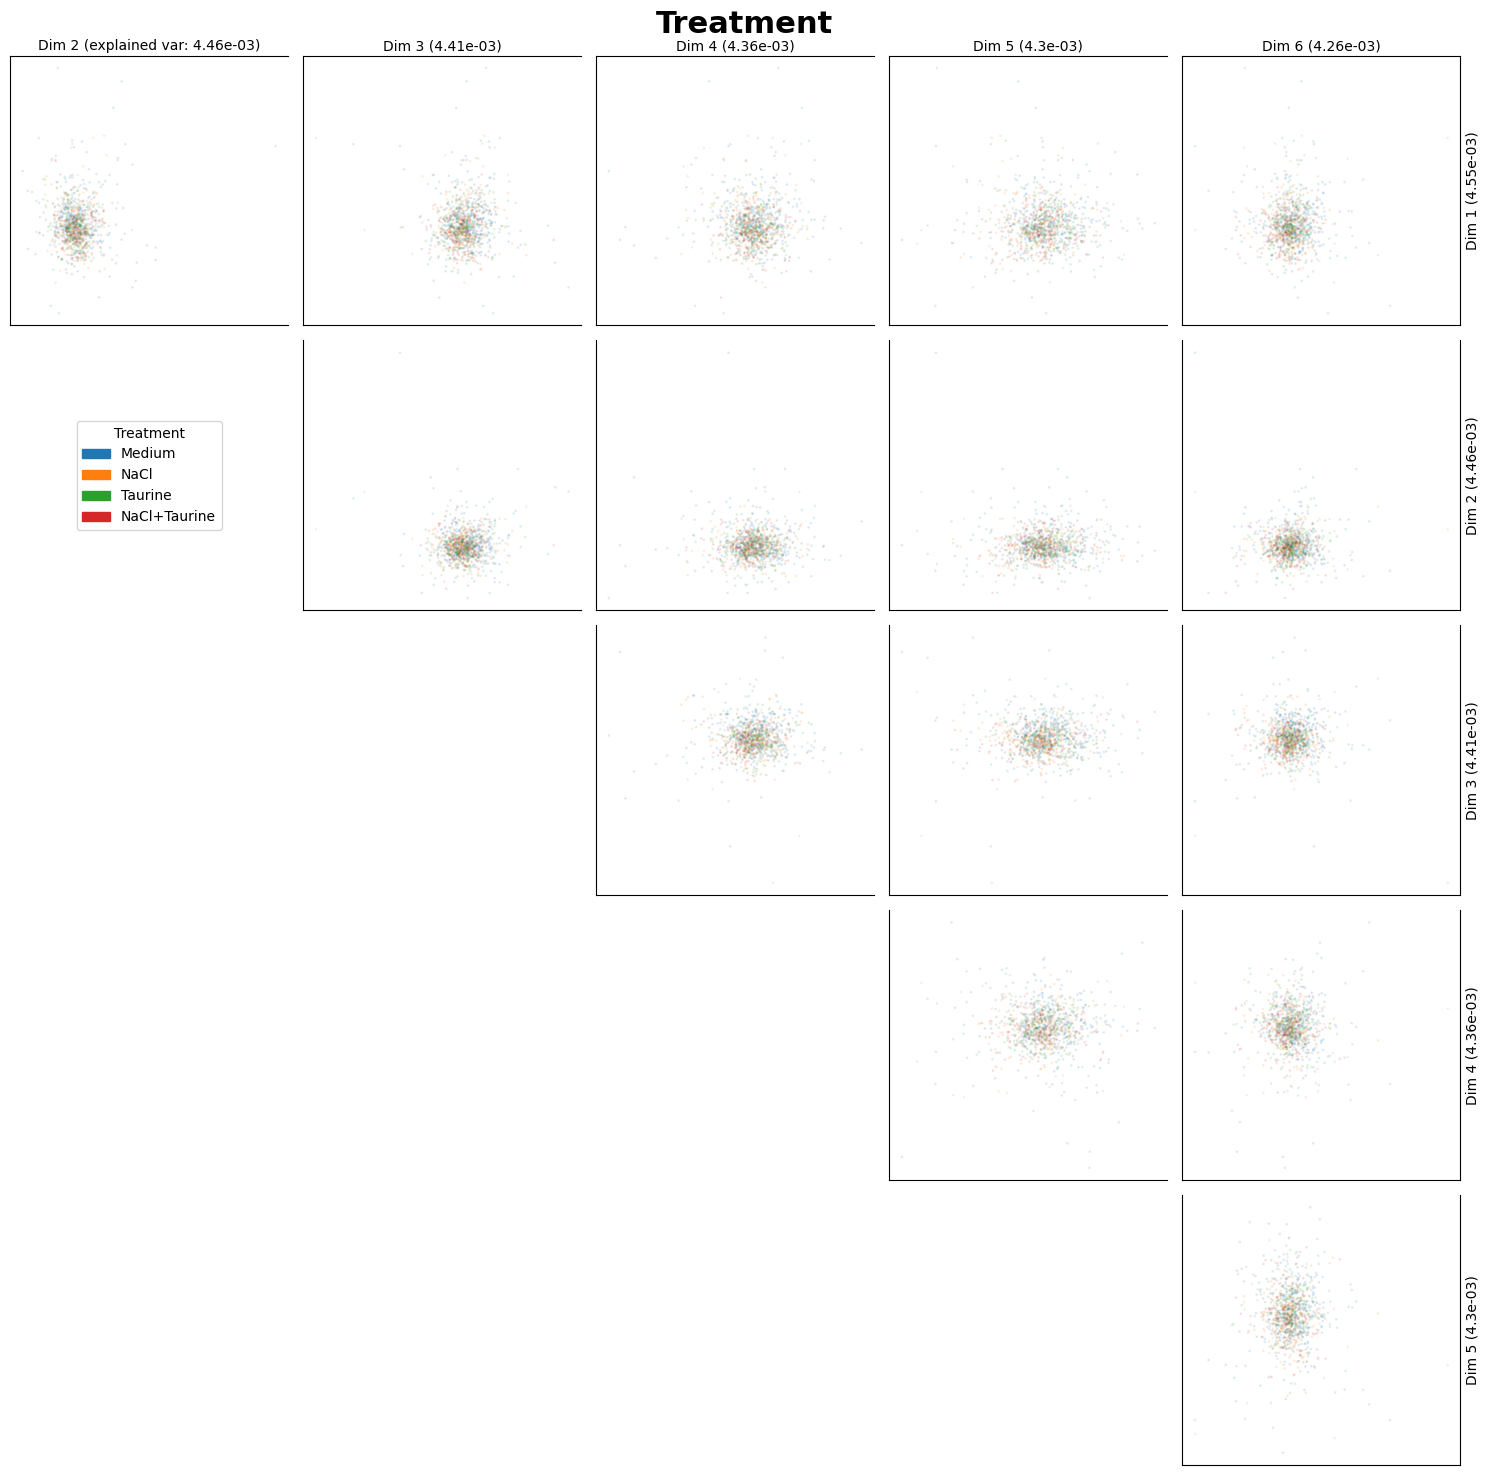
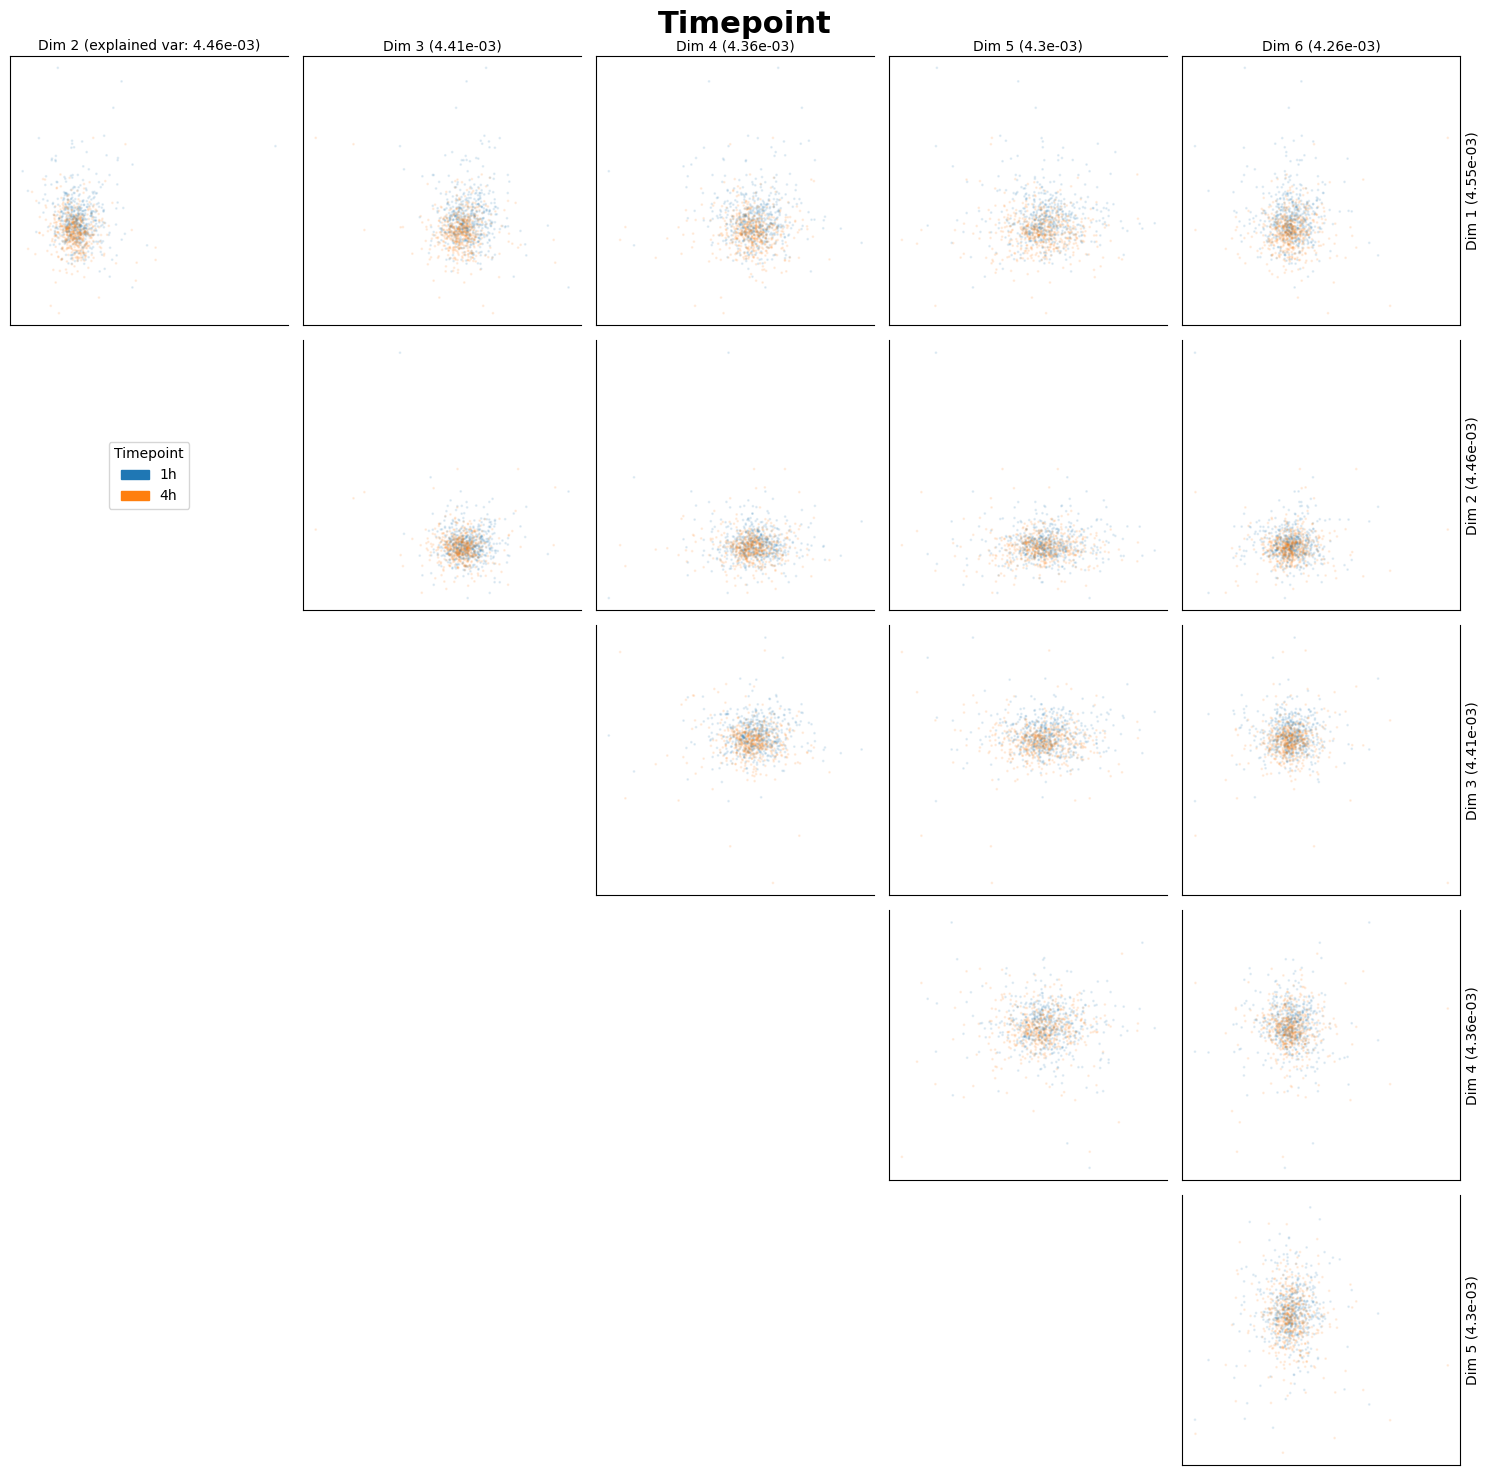
fig_ax_list = st.pl.dim_red(
    adata,
    columns=["Treatment", "Timepoint"],
)
plt.show()
sc.pp.neighbors(
    adata,
    use_rep="X_svd",
    key_added="neighbors_svd",
)
sc.tl.umap(
    adata,
    neighbors_key="neighbors_svd",
    key_added="umap_svd",
)
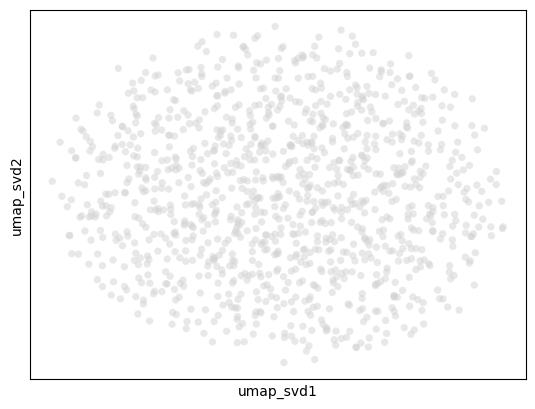
sc.pl.embedding(
    adata,
    basis="umap_svd",
    alpha=0.5,
)
06 - Clustering#
st.pp.knn_count_smoothing(adata)
KNN_binary_mean layer set as adata.X
fig, ax = st.pl.value_distribution(adata, layer = "KNN_binary_mean")
plt.show()
markerdict = {
"T_cells": [
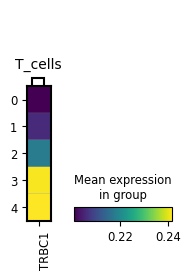
"CD3D", "CD3E", "TRBC1",
"CD4", "IL7R", "CD8A", "CD8B",
],
"B_cells": [
"MS4A1", "CD79A", "CD79B", "CD37"
],
"NK_cells": [
"NKG7", "GNLY", "KLRD1", "FCGR3A"
],
"Monocytes_Macrophages": [
"LYZ", "LST1", "S100A8", "S100A9",
"CTSD", "CST3", "LGALS3",
"CD14", "CD68"
],
"Dendritic_cells": [
"FCER1A", "CST3", "CLEC10A", "CD1C"
]
}
for ctype in sorted(markerdict):
for marker in set(markerdict[ctype]):
if marker not in adata.var_names:
print(f"{ctype} marker gene '{marker}' is not present in adata.var_names (removing)")
markerdict[ctype].remove(marker)
if len(markerdict[ctype]) == 0:
del markerdict[ctype]
B_cells marker gene 'CD79B' is not present in adata.var_names (removing)
B_cells marker gene 'MS4A1' is not present in adata.var_names (removing)
B_cells marker gene 'CD37' is not present in adata.var_names (removing)
B_cells marker gene 'CD79A' is not present in adata.var_names (removing)
Dendritic_cells marker gene 'CST3' is not present in adata.var_names (removing)
Dendritic_cells marker gene 'FCER1A' is not present in adata.var_names (removing)
Dendritic_cells marker gene 'CLEC10A' is not present in adata.var_names (removing)
Dendritic_cells marker gene 'CD1C' is not present in adata.var_names (removing)
Monocytes_Macrophages marker gene 'CD14' is not present in adata.var_names (removing)
Monocytes_Macrophages marker gene 'CTSD' is not present in adata.var_names (removing)
Monocytes_Macrophages marker gene 'LST1' is not present in adata.var_names (removing)
Monocytes_Macrophages marker gene 'S100A9' is not present in adata.var_names (removing)
Monocytes_Macrophages marker gene 'LGALS3' is not present in adata.var_names (removing)
Monocytes_Macrophages marker gene 'CST3' is not present in adata.var_names (removing)
Monocytes_Macrophages marker gene 'S100A8' is not present in adata.var_names (removing)
Monocytes_Macrophages marker gene 'CD68' is not present in adata.var_names (removing)
Monocytes_Macrophages marker gene 'LYZ' is not present in adata.var_names (removing)
NK_cells marker gene 'GNLY' is not present in adata.var_names (removing)
NK_cells marker gene 'KLRD1' is not present in adata.var_names (removing)
NK_cells marker gene 'FCGR3A' is not present in adata.var_names (removing)
NK_cells marker gene 'NKG7' is not present in adata.var_names (removing)
T_cells marker gene 'CD4' is not present in adata.var_names (removing)
T_cells marker gene 'IL7R' is not present in adata.var_names (removing)
T_cells marker gene 'CD3D' is not present in adata.var_names (removing)
T_cells marker gene 'CD8B' is not present in adata.var_names (removing)
T_cells marker gene 'CD3E' is not present in adata.var_names (removing)
T_cells marker gene 'CD8A' is not present in adata.var_names (removing)
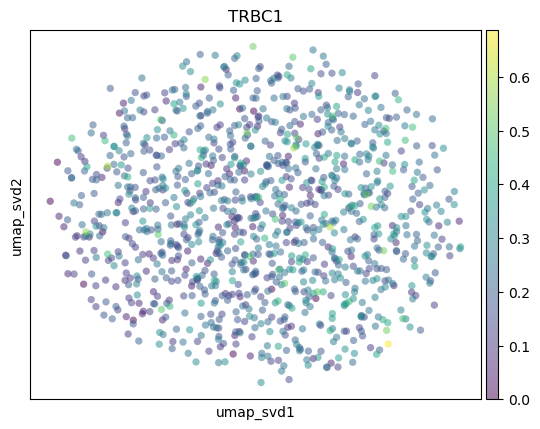
for ctype, markers in markerdict.items():
    if len(markers) == 0:
        continue

    print(ctype)
    sc.pl.embedding(
        adata,
        basis="umap_svd",
        color=markers,
        layer="KNN_binary_mean",
        ncols=3,
        alpha=0.5,
    )
T_cells
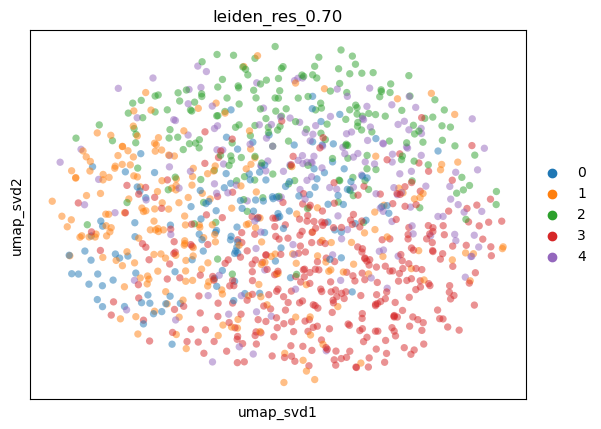
res=0.7
key = f"leiden_res_{res:.2f}"
sc.tl.leiden(
    adata,
    resolution=res,
    neighbors_key="neighbors_svd",
    key_added=key,
    flavor="igraph",
    n_iterations=2,
    directed=False,
    random_state=42,
)
sc.pl.embedding(
    adata,
    basis="umap_svd",
    color=key,
    alpha=0.5,
)
mp = sc.pl.MatrixPlot(
    adata,
    markerdict,
    groupby=key,
    layer="KNN_binary_mean",
    var_group_rotation=0,
)
ax = mp.get_axes()["mainplot_ax"]
_ = plt.setp(ax.get_xticklabels(), ha="right", rotation_mode="anchor")
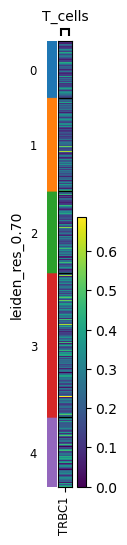
sc.pl.heatmap(
    adata,
    markerdict,
    groupby=key,
    layer="KNN_binary_mean",
    var_group_rotation=0,
)
# TODO: redo
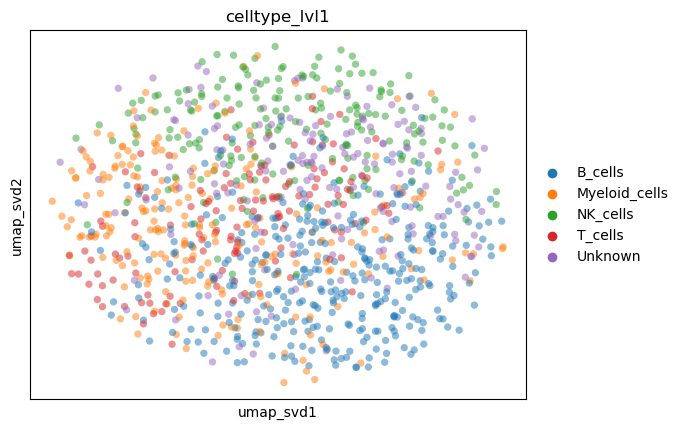
ctype_key = "celltype_lvl1"
cluster2ctype = {
"0":"T_cells",
"1":"Myeloid_cells",
"2":"NK_cells",
"3":"B_cells",
"4":"Unknown",
}
adata.obs[ctype_key] = adata.obs[key].astype(str).replace(cluster2ctype).astype("category")
sc.pl.embedding(
    adata,
    basis="umap_svd",
    color=ctype_key,
    alpha=0.5,
)
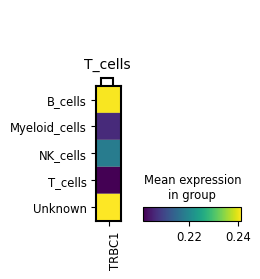
mp = sc.pl.MatrixPlot(
    adata,
    markerdict,
    groupby=ctype_key,
    layer="KNN_binary_mean",
    var_group_rotation=0,
)
ax = mp.get_axes()["mainplot_ax"]
_ = plt.setp(ax.get_xticklabels(), ha="right", rotation_mode="anchor")
df = st.pp.pseudobulk(
    adata,
    samples_column="sample",
    cluster_column=ctype_key,
    cluster="T_cells",
)
df
| Medium_1h_don1 | Medium_1h_don2 | Medium_1h_don3 | Medium_1h_don4 | Medium_1h_don5 | Medium_1h_don6 | Medium_4h_don1 | Medium_4h_don2 | Medium_4h_don3 | Medium_4h_don4 | ... | NaCl_4h_don5 | NaCl_4h_don6 | Taurine_1h_don1 | Taurine_1h_don2 | Taurine_1h_don4 | Taurine_4h_don1 | Taurine_4h_don2 | Taurine_4h_don3 | Taurine_4h_don4 | Taurine_4h_don6 | |
|---|---|---|---|---|---|---|---|---|---|---|---|---|---|---|---|---|---|---|---|---|---|
| ABCB7 | 0 | 0 | 0 | 0 | 0 | 0 | 0 | 0 | 0 | 0 | ... | 0 | 0 | 0 | 0 | 0 | 0 | 0 | 0 | 0 | 0 |
| ABCB8 | 0 | 0 | 0 | 0 | 0 | 0 | 0 | 0 | 1 | 0 | ... | 0 | 0 | 0 | 0 | 0 | 0 | 0 | 0 | 0 | 0 |
| ABCC1 | 0 | 0 | 0 | 0 | 0 | 0 | 0 | 0 | 0 | 0 | ... | 0 | 0 | 0 | 0 | 0 | 0 | 0 | 0 | 0 | 0 |
| ABCC4 | 0 | 0 | 2 | 0 | 1 | 0 | 0 | 0 | 0 | 0 | ... | 0 | 0 | 0 | 0 | 0 | 0 | 0 | 2 | 0 | 0 |
| ABCE1 | 0 | 0 | 1 | 1 | 1 | 5 | 0 | 0 | 0 | 0 | ... | 0 | 0 | 0 | 0 | 0 | 0 | 0 | 1 | 0 | 1 |
| ... | ... | ... | ... | ... | ... | ... | ... | ... | ... | ... | ... | ... | ... | ... | ... | ... | ... | ... | ... | ... | ... |
| ZDHHC21 | 0 | 0 | 0 | 0 | 0 | 0 | 0 | 0 | 0 | 0 | ... | 0 | 0 | 0 | 0 | 0 | 0 | 0 | 0 | 0 | 0 |
| ZFP36 | 6 | 2 | 5 | 8 | 2 | 5 | 0 | 0 | 0 | 0 | ... | 1 | 0 | 3 | 3 | 1 | 0 | 0 | 0 | 1 | 0 |
| ZNF706 | 0 | 0 | 3 | 0 | 3 | 7 | 0 | 0 | 1 | 1 | ... | 0 | 0 | 0 | 2 | 1 | 0 | 0 | 0 | 0 | 2 |
| ZNRF1 | 0 | 0 | 0 | 0 | 0 | 1 | 0 | 0 | 0 | 0 | ... | 0 | 0 | 0 | 0 | 0 | 0 | 1 | 0 | 0 | 0 |
| ZWINT | 0 | 0 | 0 | 0 | 1 | 0 | 0 | 0 | 0 | 0 | ... | 0 | 1 | 0 | 0 | 0 | 0 | 0 | 0 | 0 | 0 |
945 rows × 38 columns
07 - Differential expression analysis#
# select a celltype to analyse
cdata = adata[adata.obs["celltype_lvl1"] == "T_cells", :]
# results_df = st.tl.pydeseq2(
#     cdata,
#     design="~ 'Treatment' + 'Timepoint'",
#     contrast=["Treatment", "NaCl", "Medium"],
#     return_objects=False,
# )
# results_df
# fig, axs = st.pl.pydeseq2_volcano(results_df)
# plt.show()
det_rate_df = st.pp.detection_rates(cdata, samples_column="sample")
det_rate_df
| Medium_1h_don5 | Medium_1h_don4 | Medium_1h_don6 | Medium_1h_don2 | Medium_1h_don3 | Medium_1h_don1 | Medium_4h_don4 | NaCl_1h_don2 | NaCl_4h_don2 | Taurine_4h_don2 | ... | Medium_4h_don2 | Medium_4h_don5 | NaCl+Taurine_4h_don4 | NaCl_4h_don5 | NaCl_4h_don6 | NaCl_1h_don6 | NaCl_1h_don3 | NaCl_1h_don4 | NaCl_4h_don4 | Taurine_4h_don4 | |
|---|---|---|---|---|---|---|---|---|---|---|---|---|---|---|---|---|---|---|---|---|---|
| ABCB7 | 0.000000 | 0.000000 | 0.000000 | 0.000000 | 0.000000 | 0.000000 | 0.000000 | 0.000000 | 0.083333 | 0.000000 | ... | 0.0 | 0.000000 | 0.000000 | 0.000000 | 0.000000 | 0.0 | 0.000000 | 0.0 | 0.000000 | 0.000000 |
| ABCB8 | 0.000000 | 0.000000 | 0.000000 | 0.000000 | 0.000000 | 0.000000 | 0.000000 | 0.000000 | 0.000000 | 0.000000 | ... | 0.0 | 0.000000 | 0.000000 | 0.000000 | 0.000000 | 0.0 | 0.000000 | 0.0 | 0.000000 | 0.000000 |
| ABCC1 | 0.000000 | 0.000000 | 0.000000 | 0.000000 | 0.000000 | 0.000000 | 0.000000 | 0.000000 | 0.000000 | 0.000000 | ... | 0.0 | 0.000000 | 0.000000 | 0.000000 | 0.000000 | 0.0 | 0.083333 | 0.0 | 0.000000 | 0.000000 |
| ABCC4 | 0.083333 | 0.000000 | 0.000000 | 0.000000 | 0.175000 | 0.000000 | 0.000000 | 0.000000 | 0.000000 | 0.000000 | ... | 0.0 | 0.000000 | 0.000000 | 0.000000 | 0.000000 | 0.0 | 0.083333 | 0.0 | 0.000000 | 0.000000 |
| ABCE1 | 0.083333 | 0.083333 | 0.431035 | 0.000000 | 0.083333 | 0.000000 | 0.000000 | 0.083333 | 0.000000 | 0.000000 | ... | 0.0 | 0.000000 | 0.000000 | 0.000000 | 0.000000 | 0.0 | 0.000000 | 0.0 | 0.000000 | 0.000000 |
| ... | ... | ... | ... | ... | ... | ... | ... | ... | ... | ... | ... | ... | ... | ... | ... | ... | ... | ... | ... | ... | ... |
| ZDHHC21 | 0.000000 | 0.000000 | 0.000000 | 0.000000 | 0.000000 | 0.000000 | 0.000000 | 0.000000 | 0.000000 | 0.000000 | ... | 0.0 | 0.083333 | 0.000000 | 0.000000 | 0.000000 | 0.0 | 0.000000 | 0.0 | 0.000000 | 0.000000 |
| ZFP36 | 0.166667 | 0.583333 | 0.431035 | 0.172043 | 0.388889 | 0.421053 | 0.000000 | 0.083333 | 0.352941 | 0.000000 | ... | 0.0 | 0.083333 | 0.083333 | 0.083333 | 0.000000 | 0.0 | 0.000000 | 0.0 | 0.083333 | 0.083333 |
| ZNF706 | 0.166667 | 0.000000 | 0.254237 | 0.000000 | 0.276316 | 0.000000 | 0.083333 | 0.000000 | 0.000000 | 0.000000 | ... | 0.0 | 0.000000 | 0.000000 | 0.000000 | 0.000000 | 0.0 | 0.000000 | 0.0 | 0.000000 | 0.000000 |
| ZNRF1 | 0.000000 | 0.000000 | 0.083333 | 0.000000 | 0.000000 | 0.000000 | 0.000000 | 0.000000 | 0.000000 | 0.083333 | ... | 0.0 | 0.000000 | 0.000000 | 0.000000 | 0.000000 | 0.0 | 0.000000 | 0.0 | 0.000000 | 0.000000 |
| ZWINT | 0.083333 | 0.000000 | 0.000000 | 0.000000 | 0.000000 | 0.000000 | 0.000000 | 0.000000 | 0.083333 | 0.000000 | ... | 0.0 | 0.000000 | 0.000000 | 0.000000 | 0.083333 | 0.0 | 0.000000 | 0.0 | 0.000000 | 0.000000 |
945 rows × 38 columns
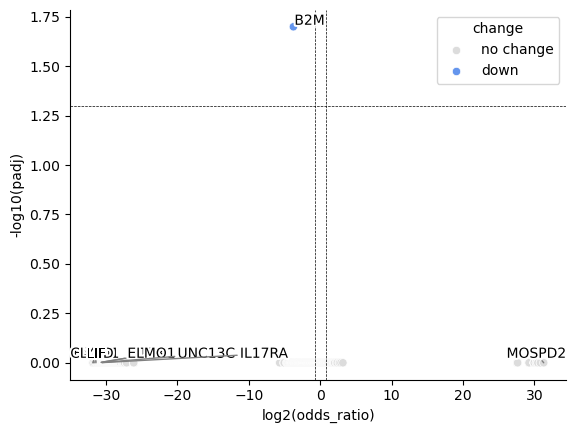
results_df = st.tl.paired_binomial_glm(
    det_rate_df,
    cdata,
    samples_column="sample",
    test_condition="NaCl",
    reference_condition="Medium",
    condition_column="Treatment",
    covariate_columns=["Timepoint"],
)
results_df
/home/siebrenf/git/stampede/stampede/_tools/statsmodels.py:177: RuntimeWarning: Perfect separation detected in 41 genes. Parameter estimates may be unstable for these genes. Check the 'perfect_separation' column in the results.
  warnings.warn(
| gene | beta | se | odds_ratio | pval | perfect_separation | error | padj | -log10(padj) | log2(odds_ratio) | |
|---|---|---|---|---|---|---|---|---|---|---|
| 289 | ERP44 | -22.079146 | 26030.162254 | 2.577203e-10 | 0.999323 | False | None | 1.0 | -0.0 | -31.853475 |
| 132 | CAND1 | -22.036895 | 26042.032823 | 2.688425e-10 | 0.999325 | False | None | 1.0 | -0.0 | -31.792520 |
| 493 | LY6D | -21.891387 | 26082.472539 | 3.109505e-10 | 0.999330 | False | None | 1.0 | -0.0 | -31.582596 |
| 474 | LIF | -21.772220 | 26109.118763 | 3.503038e-10 | 0.999335 | False | None | 1.0 | -0.0 | -31.410674 |
| 484 | LPL | -21.738470 | 26116.511965 | 3.623285e-10 | 0.999336 | False | None | 1.0 | -0.0 | -31.361983 |
| ... | ... | ... | ... | ... | ... | ... | ... | ... | ... | ... |
| 736 | RNF121 | 21.095117 | 15090.570398 | 1.450417e+09 | 0.998885 | False | None | 1.0 | -0.0 | 30.433821 |
| 889 | TRIM28 | 21.126632 | 21604.504143 | 1.496855e+09 | 0.999220 | False | None | 1.0 | -0.0 | 30.479287 |
| 882 | TOMM70 | 21.360697 | 15206.595748 | 1.891615e+09 | 0.998879 | False | None | 1.0 | -0.0 | 30.816971 |
| 320 | FSTL1 | 21.360697 | 15206.595748 | 1.891615e+09 | 0.998879 | False | None | 1.0 | -0.0 | 30.816971 |
| 543 | MOSPD2 | 21.691319 | 21561.787022 | 2.632814e+09 | 0.999197 | False | None | 1.0 | -0.0 | 31.293958 |
945 rows × 10 columns
fig, ax = st.pl.paired_binomial_glm_volcano(results_df)
plt.show()